Mastering Market Analysis for Ultra-High-Net-Worth Investors
What Does Recent Market Analysis News Mean for Your Portfolio?
Recent market analysis news, such as CNBC's Elite Advisors list for 2026, recognizes 25 top investment advisors for ultra-high-net-worth clients with $25 million or more in assets. This list evaluates firms based on expertise in complex financial services, highlighting the importance of sophisticated market analysis for high-net-worth individuals. For instance, the list's inaugural edition received over 3,200 views and 46 likes on CNBC Television, indicating a strong interest in ultra-high-net-worth wealth management.
As an investor, understanding how these top advisors approach market analysis can help you make more informed decisions about your own portfolio. With the right strategies, you can protect your wealth and potentially generate significant returns, even in uncertain market conditions.
Who Should Read This
Live Market Data
This article is designed for experienced traders and investors looking to refine their market analysis skills and ultra-high-net-worth individuals seeking to optimize their investment strategies, with at least $1 million in investable assets.
Whether you're managing a large portfolio or seeking to grow your wealth, mastering market analysis is crucial for achieving your financial goals. By understanding the core concepts and strategies outlined in this article, you'll be better equipped to navigate complex markets and make informed decisions about your investments.
The Core Concept
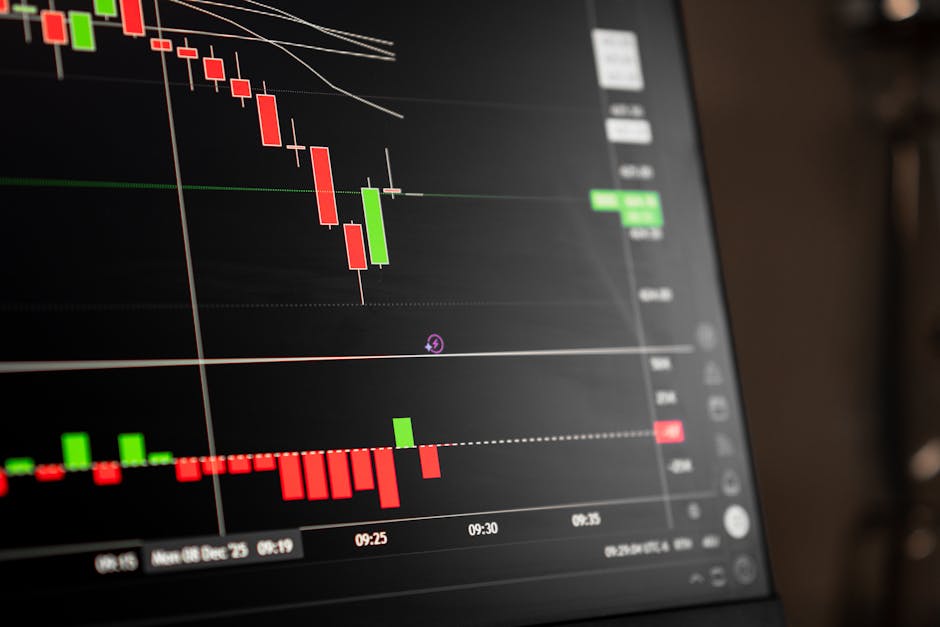
At its core, market analysis involves using various techniques, such as technical indicators, chart patterns, and sentiment analysis, to understand market trends and make predictions about future price movements. For example, the 50-day moving average of the SPY ETF can provide key support for the overall market, while the relative strength index (RSI) can help identify overbought or oversold conditions.
By combining these techniques with a deep understanding of market fundamentals, you can develop a comprehensive view of the market and make more accurate predictions about future price movements. This, in turn, can help you optimize your investment strategies and achieve your financial goals.
Technical Indicators
Technical indicators, such as moving averages and RSI, can provide valuable insights into market trends and potential trading opportunities. For instance, a golden cross, where the 50-day moving average crosses above the 200-day moving average, can be a bullish signal for stocks like AAPL.
Meanwhile, a death cross, where the 50-day moving average crosses below the 200-day moving average, can be a bearish signal for the QQQ ETF. By understanding how to use these indicators effectively, you can refine your trading strategies and make more informed decisions about your investments.
What Most People Get Wrong
Many investors make the mistake of relying too heavily on a single indicator or strategy, rather than taking a comprehensive approach to market analysis. For example, some traders may focus solely on chart patterns, without considering the underlying market fundamentals or sentiment analysis.
Others may fail to account for risk management, such as position sizing and stop-loss orders, which can help mitigate potential losses and protect their wealth. By avoiding these common mistakes, you can develop a more effective approach to market analysis and improve your overall investment performance.
How It Actually Works
Effective market analysis involves a combination of technical, fundamental, and sentiment analysis. For instance, you might use technical indicators, such as the 50-day moving average, to identify trends and potential trading opportunities, while also considering fundamental factors, such as earnings growth and valuation metrics.
Meanwhile, sentiment analysis can help you understand market psychology and identify potential contrarian opportunities. By combining these approaches, you can develop a nuanced view of the market and make more informed decisions about your investments. For example, if the SPY ETF is trading above its 200-day moving average, with an RSI below 30, it may be a buying opportunity.
Volume Analysis
Volume analysis can provide valuable insights into market trends and potential trading opportunities. For instance, a significant increase in trading volume can confirm a breakout or trend reversal, while a decrease in volume can indicate a lack of conviction among traders.
By analyzing volume patterns and trends, you can refine your trading strategies and make more informed decisions about your investments. For example, if the QQQ ETF is experiencing a significant increase in trading volume, with a corresponding increase in price, it may be a bullish signal for the tech sector.
Real-World Application
A real-world example of effective market analysis can be seen in the approach taken by top investment advisors, such as those recognized on CNBC's Elite Advisors list. These advisors typically take a comprehensive approach to market analysis, combining technical, fundamental, and sentiment analysis to develop a nuanced view of the market.
For instance, they might use technical indicators, such as the 50-day moving average, to identify trends and potential trading opportunities, while also considering fundamental factors, such as earnings growth and valuation metrics. By taking a similar approach, you can refine your own investment strategies and achieve better results.
The Strategy
A specific strategy for applying market analysis to your investments might involve using a combination of technical and fundamental analysis to identify potential trading opportunities. For example, you might use the 50-day moving average to identify trends, while also considering fundamental factors, such as earnings growth and valuation metrics.
Meanwhile, you might use sentiment analysis to identify potential contrarian opportunities, such as buying into a stock like AAPL when sentiment is bearish. By combining these approaches, you can develop a nuanced view of the market and make more informed decisions about your investments. For instance, if the SPY ETF is trading above its 200-day moving average, with an RSI below 30, you might consider buying into the market, with a position size of 2% and a stop-loss order at 5% below your entry price.
Your Next Step
Based on the insights and strategies outlined in this article, your next step might be to review your current investment portfolio and consider how you can apply more effective market analysis to your decision-making process. For example, you might start by analyzing the technical indicators and chart patterns for your current holdings, such as the QQQ ETF, to identify potential trading opportunities or risks.
Meanwhile, you might also consider allocating a portion of your portfolio to a specific stock, such as AAPL, based on its fundamental strengths and valuation metrics. By taking a more proactive and informed approach to market analysis, you can refine your investment strategies and achieve better results over the long term. Set an alert at $150 for AAPL and consider allocating 5% of your portfolio to this stock if it reaches this level, with a stop-loss order at 10% below your entry price.
Last updated: June 2026
By the Investing Strategies Editorial Team
This content is for informational purposes only. Not financial advice—always do your own analysis before making investment decisions.