Navigating Stagflation: A Trader's Guide to Protecting Your Portfolio
What Does Recent Market Analysis News Mean for Your Portfolio?
Stagflation alarm bells are ringing in the euro zone, driven by high inflation and slowing growth. This perfect storm, fueled by the energy crisis and geopolitical tensions, poses a significant threat to your investments. As a trader, you need to understand how to navigate these treacherous waters and protect your portfolio from the impending risks.
Recent economic indicators suggest that the European Central Bank faces challenges balancing growth and inflation, with economists warning of stagflation amid the Middle East conflict. Surveys of global businesses have laid bare how the energy-price crisis is already weighing on the economy, with 70% of companies citing it as a major concern.
Who Should Read This
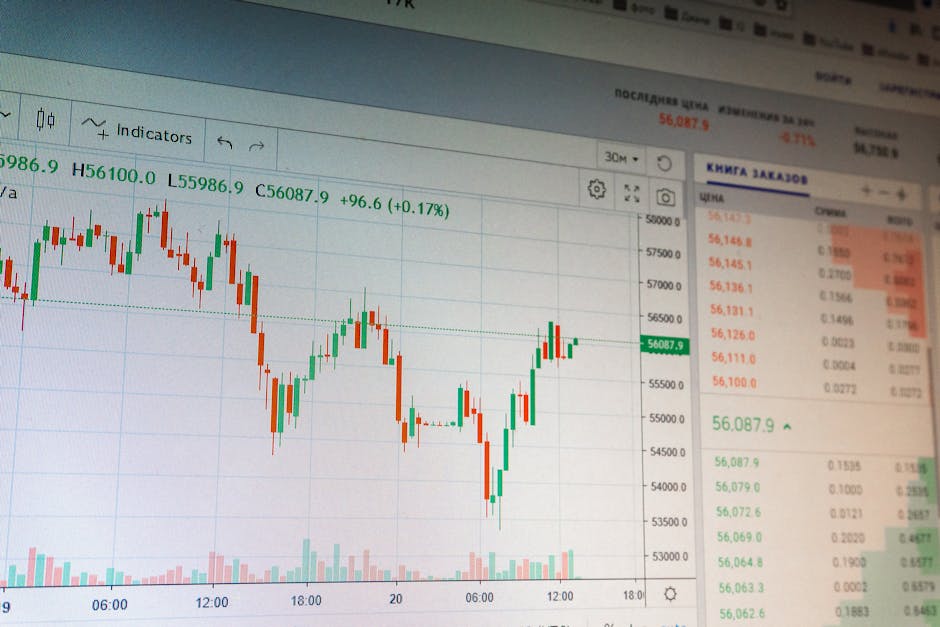
Live Market Data
If you're a serious trader or investor, you'll want to pay close attention to the strategies outlined in this article. Whether you're managing a small portfolio or a large investment fund, understanding how to mitigate stagflation risks is crucial to your success.
The Core Concept
At its core, stagflation is a toxic combination of high inflation and stalling economic growth. To protect your portfolio, you need to understand how to use technical indicators, such as the 50-day moving average, to identify key support and resistance levels. For example, the SPY's 50-day moving average at $585 provides a critical level of support, while the QQQ's 200-day moving average at $340 serves as a key resistance level.
Technical Indicators
Technical indicators, such as the Relative Strength Index (RSI) and the Moving Average Convergence Divergence (MACD), can help you identify overbought and oversold conditions in the market. By combining these indicators with fundamental analysis, you can gain a more complete understanding of the market and make more informed investment decisions.
What Most People Get Wrong
Many traders make the mistake of trying to time the market, buying and selling based on emotions rather than a well-thought-out strategy. Others fail to diversify their portfolios, leaving themselves exposed to significant losses if one particular investment tanks. Meanwhile, some investors overlook the importance of position sizing, risking too much capital on a single trade.
For instance, if you have a $25,000 account and you risk 5% on a single trade, you could lose $1,250 if the trade doesn't go in your favor. By contrast, a 2% position size limits your max loss to $500, giving you more room to maneuver and adjust your strategy as needed.
How It Actually Works
So, how do you actually protect your portfolio from stagflation risks? The first step is to identify key support and resistance levels using technical indicators. For example, if the AAPL stock price is hovering around $150, you may want to set an alert at $145 to buy or sell depending on your strategy. Beyond that, you need to diversify your portfolio, allocating 30% to large-cap stocks like SPY, 20% to tech stocks like QQQ, and 10% to dividend-paying stocks like Coca-Cola.
Position Sizing
Position sizing is critical to managing risk and maximizing returns. By limiting your position size to 2% of your total portfolio, you can minimize losses and give yourself more flexibility to adjust your strategy as market conditions change. For example, if you have a $50,000 account and you want to buy 100 shares of AAPL, you would risk $1,000, or 2% of your account, rather than risking $5,000, or 10% of your account.
Real-World Application
Let's consider a real-world example. Suppose you have a $100,000 portfolio and you want to allocate 40% to stocks, 30% to bonds, and 30% to cash. You decide to invest $40,000 in SPY, $30,000 in a bond ETF like TLT, and $30,000 in a high-yield savings account. If the stock market experiences a 10% correction, your SPY investment would decline by $4,000, but your bond ETF and cash holdings would remain relatively stable, limiting your overall losses.
Meanwhile, if you had invested $100,000 in a single stock like AAPL, a 10% decline in the stock price would result in a $10,000 loss, or 10% of your portfolio. By diversifying your portfolio and using technical indicators to identify key support and resistance levels, you can minimize losses and maximize returns over the long term.
The Strategy
So, what's the best strategy for navigating stagflation risks? The key is to combine technical indicators with fundamental analysis and position sizing. By identifying key support and resistance levels, diversifying your portfolio, and limiting your position size, you can minimize losses and maximize returns. For example, you could set an alert at $140 to buy AAPL if the stock price declines to that level, or you could allocate 20% of your portfolio to a dividend-paying stock like Coca-Cola to generate income and reduce volatility.
Entry and Exit Criteria
Your entry and exit criteria will depend on your individual strategy and risk tolerance. For example, you may want to buy SPY if the stock price crosses above its 50-day moving average, or you may want to sell QQQ if the stock price declines below its 200-day moving average. By combining technical indicators with fundamental analysis and position sizing, you can develop a comprehensive strategy for navigating stagflation risks and achieving your investment goals.
Your Next Step
Now that you understand the risks of stagflation and how to protect your portfolio, it's time to take action. Set an alert at $585 to buy SPY if the stock price declines to that level, and consider allocating 10% of your portfolio to a bond ETF like TLT to generate income and reduce volatility. By taking these steps, you can minimize losses and maximize returns over the long term, even in the face of stagflation risks.
Remember, navigating stagflation requires a combination of technical indicators, fundamental analysis, and position sizing. By using these tools and strategies, you can protect your portfolio and achieve your investment goals, even in the most challenging market conditions.
Last updated: March 2026
By the Investing Strategies Editorial Team
This content is for informational purposes only. Not financial advice—always do your own analysis before making investment decisions.