Navigating Market Volatility with Data-Driven Strategies
What Recent Market Analysis News Means for Your Portfolio
Recent market analysis news has left many investors wondering what it means for their portfolio. With Germany's economy projected to grow by 1.1% in 2026, according to Goldman Sachs, and the OECD forecasting 0.4% growth in 2025 and 1.2% in 2026, it's clear that global factors are having a significant impact on economic forecasts. As an investor, you need to stay informed and adapt your strategy to navigate market volatility.
For example, if you're holding shares of AAPL, you'll want to keep an eye on the company's valuation metrics, such as its price-to-earnings ratio, which currently stands at around 25. Meanwhile, the SPY's 50-day moving average at $585 provides key support, and a 2% position size limits your max loss to $500 on a $25,000 account.
Who Should Read This
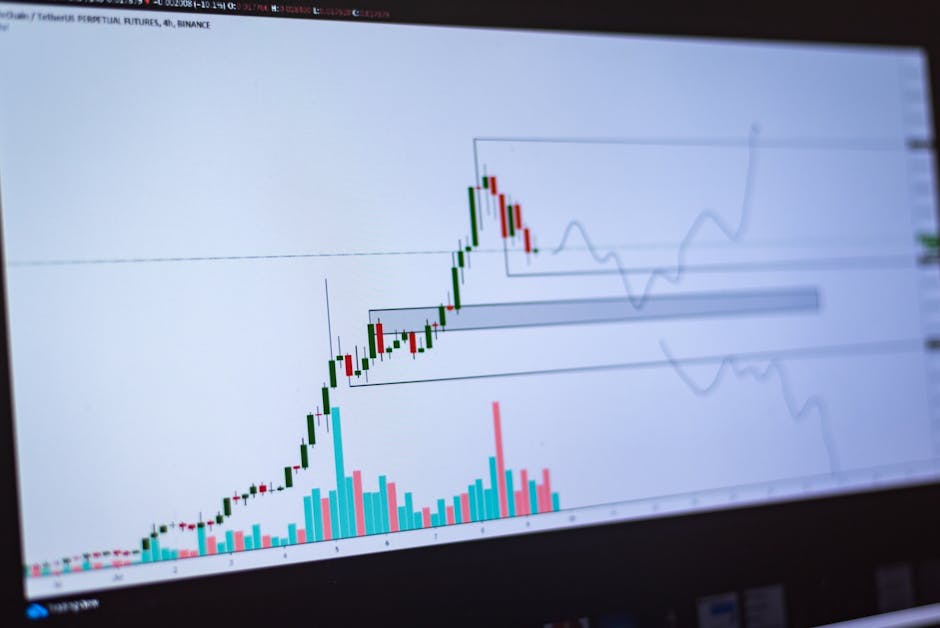
Live Market Data
This article is for investors who want to stay ahead of the curve and make informed decisions about their portfolio. Whether you're a seasoned trader or just starting out, you'll benefit from the actionable advice and real-world examples provided here.
By reading this article, you'll gain a deeper understanding of market analysis and how to apply it to your investment strategy. You'll learn how to analyze trends, identify key support and resistance levels, and make data-driven decisions to maximize your returns.
The Core Concept
The core concept of market analysis is to understand the underlying trends and patterns that drive market movements. By analyzing charts, technical indicators, and sentiment analysis, you can gain insights into what's really driving the market. For instance, the QQQ's relative strength index (RSI) is currently at 60, indicating a moderate level of bullishness.
A key example of this is the concept of support and resistance. By identifying key levels of support and resistance, you can anticipate where the market is likely to move next. For example, if the SPY is trading at $580, and the 50-day moving average is at $585, you can anticipate that the market may bounce off this level and head higher.
Technical Indicators
Technical indicators, such as moving averages and RSI, can provide valuable insights into market trends. By analyzing these indicators, you can identify patterns and anticipate future movements. For example, if the 50-day moving average is above the 200-day moving average, it's a bullish sign, and you may want to consider buying.
- Use a combination of technical indicators to confirm trends
- Analyze charts to identify key support and resistance levels
- Stay up-to-date with market news and analysis to stay informed
What Most People Get Wrong
Most people get market analysis wrong by relying on emotions and intuition rather than data and facts. They may also fail to consider the bigger picture and the impact of global factors on economic forecasts. For example, the war in Iran and the resulting sharp rise in energy prices have significantly lowered economic forecasts for this year.
Additionally, many investors fail to diversify their portfolio, putting too much weight on a single stock or sector. This can lead to significant losses if the market moves against them. For instance, if you're holding a large position in AAPL and the stock price drops, you could lose a substantial amount of money.
How It Actually Works
Market analysis works by analyzing trends, patterns, and technical indicators to anticipate future market movements. By using a combination of technical and fundamental analysis, you can gain a deeper understanding of the market and make informed decisions about your portfolio. For example, if you're considering buying shares of SPY, you'll want to analyze the ETF's holdings, including its top 10 holdings, which currently include AAPL, MSFT, and AMZN.
The process involves identifying key support and resistance levels, analyzing technical indicators, and staying up-to-date with market news and analysis. By following this process, you can develop a data-driven strategy that helps you navigate market volatility and achieve your investment goals. For instance, you could set an alert at $580 for the SPY, and if the price reaches that level, you could consider buying.
Real-World Application
A real-world example of market analysis in action is the recent performance of the QQQ. By analyzing the ETF's chart and technical indicators, you can see that it's been trending upwards, with a few minor pullbacks along the way. For instance, the QQQ's 50-day moving average is currently at $340, and its RSI is at 65, indicating a strong bullish trend.
By applying market analysis to your portfolio, you can identify opportunities and risks, and make informed decisions about your investments. For example, if you're holding shares of QQQ, you may want to consider taking profits if the price reaches $350, or you could consider buying more shares if the price pulls back to $320.
The Strategy
A data-driven strategy for navigating market volatility involves combining technical and fundamental analysis to anticipate future market movements. By identifying key support and resistance levels, analyzing technical indicators, and staying up-to-date with market news and analysis, you can develop a comprehensive strategy that helps you achieve your investment goals.
For example, you could use a combination of moving averages and RSI to identify trends and anticipate future movements. You could also use sentiment analysis to gauge market sentiment and identify potential opportunities. By following this strategy, you can navigate market volatility and achieve your investment goals. For instance, you could allocate 20% of your portfolio to the SPY, 30% to the QQQ, and 50% to individual stocks like AAPL and MSFT.
Your Next Step
Your next step is to apply the principles of market analysis to your portfolio. Start by analyzing your current holdings and identifying areas where you can improve your strategy. Consider using technical indicators, such as moving averages and RSI, to anticipate future market movements. For example, you could set an alert at $600 for the SPY, and if the price reaches that level, you could consider selling. Alternatively, you could allocate 10% of your portfolio to the QQQ, and if the price pulls back to $320, you could consider buying more shares.
By taking this step, you can develop a data-driven strategy that helps you navigate market volatility and achieve your investment goals. Remember to stay up-to-date with market news and analysis, and be prepared to adapt your strategy as market conditions change. For instance, if the OECD revises its forecast for Germany's economy, you may want to reconsider your investment strategy and adjust your portfolio accordingly.
Last updated: April 2026
By the Investing Strategies Editorial Team
This content is for informational purposes only. Not financial advice—always do your own analysis before making investment decisions.